Exercise Results Curve: Our Personal Training Center Can Help You Reach Your Goals and Maximize Your Genetic Potential
Continued results from exercise are dependent upon the proper manipulation of stimulus and recovery. Hence, the equation S = R. If this equation is balanced, than results from exercise will be forthcoming. If the equation is not balanced (S ≠ R), by either having too much stimulus or not enough recovery, results from exercise will be, at best, slow or non existent, or at worst, detrimental. Although there are many extraneous variables that affect the equilibrium of the above equation (diet, sleep, stress level, work environment, additional activity / recreation), exercise clinicians only have direct manipulation of a few variables when training clients. Roughly, these variables are the amount of exercise (duration and volume), frequency of exercise, and intensity of exercise.
These three variables are inversely proportional; as one increases, the others must decrease. This became clinically obvious to me while I was attending the University of New Orleans as an undergraduate in Exercise Physiology at the same time training clients at a local Nautilus club using high intensity training methods. As I had already been training clients for several years, I often used the data collected from my clientele for class papers and projects. During that time, I wrote a paper entitled “Exercise Results Curve”. Unfortunately, the original data collected for the paper has long been misplaced, as this was in the early 1990s. However, a few years ago I started analyzing client progress charts in order to duplicate the original examples. Figure 1 shows an example of a typical male subject who was already trained with traditional methods (higher volume / frequency), without a strict focus on progress.
These three variables are inversely proportional; as one increases, the others must decrease. This became clinically obvious to me while I was attending the University of New Orleans as an undergraduate in Exercise Physiology at the same time training clients at a local Nautilus club using high intensity training methods. As I had already been training clients for several years, I often used the data collected from my clientele for class papers and projects. During that time, I wrote a paper entitled “Exercise Results Curve”. Unfortunately, the original data collected for the paper has long been misplaced, as this was in the early 1990s. However, a few years ago I started analyzing client progress charts in order to duplicate the original examples. Figure 1 shows an example of a typical male subject who was already trained with traditional methods (higher volume / frequency), without a strict focus on progress.
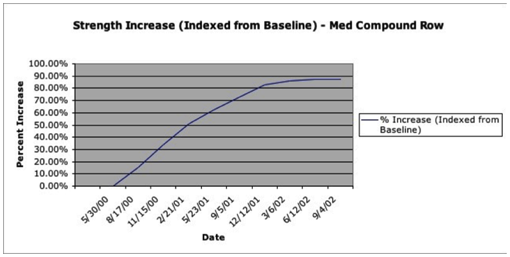
When I wrote the original paper, my goal was simply to determine the approximate amount of time (years) it took most clients to approach their maximum genetic strength. As it were, most subjects approached this limit in approximately two years, as long as stimulus and recovery were properly balanced. However, during the original data analysis, several other issues became apparent. If the equation was not balanced (S ≠ R), subjects hit an artificial plateau. This was evident when comparing client frequency as well as those participating in other activities, generally some form of endurance training. Figure 2 illustrates this point.
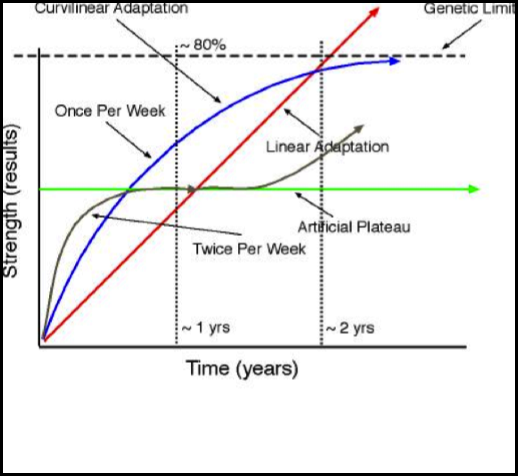
Generally, most clients starting twice per week (dark green line) gained strength faster than the once per week clients (blue line), but hit a plateau much sooner (light green line). On the other hand, clients starting once per week progressed slower, at first, but continued to improve for a much longer period of time. The red line is fictional, indicating the thinking of many lay subjects (more is better philosophy). Usually, when a particular twice per week subject reduced the frequency of training to once per week, strength increases were almost immediate and continuous. From my recollection, this occurred in approximately 97% of the original subjects. Rarely did the reverse occur, although, there were a small percentage of subjects who progressed less when transitioning to the once per week schedule. However small (3%), I could not ignore this statistic and have spent my entire career researching and attempting to understand inter-individual variability in response to resistance exercise. Much of this data was presented in my “Genetic Variability” lecture at the 2006 High Intensity Training seminar in Indianapolis. Although, that is beyond the scope of this article.
Ryan A. Hall
Ryan A. Hall
Visit Our Personal Fitness Training Center in New Orleans, LA to Find Out More.


